Veterinarian statistics: how many vets there are, state by state
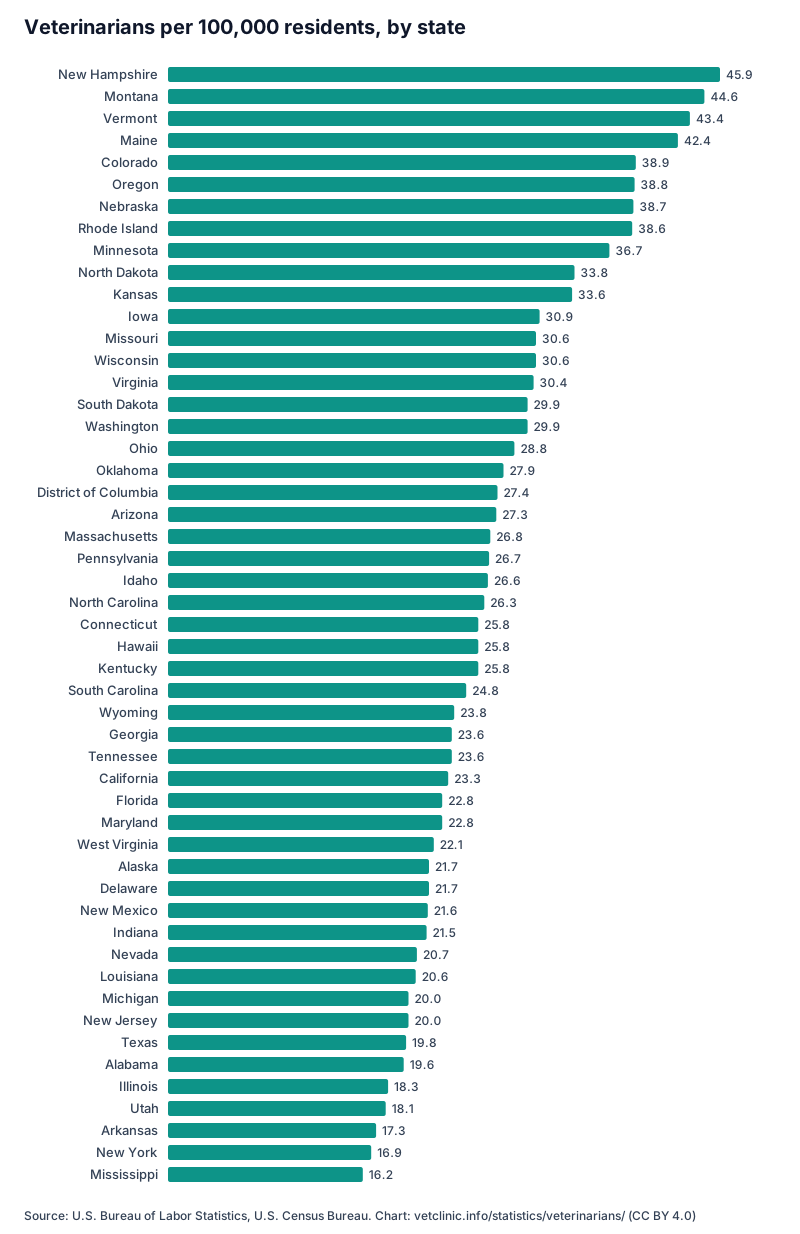
The United States had 83,900 veterinarians in wage-and-salary jobs in May 2025, about 24.5 per 100,000 residents, and the rate ranged from 45.9 in New Hampshire to 16.2 in Mississippi. Source: BLS OEWS, May 2025; Census Bureau, data as of May 2025.
Key statistics
- 83,900 veterinarians worked in wage-and-salary jobs in the United States in May 2025, or 24.5 per 100,000 residents. (BLS OEWS, May 2025; Census Bureau)
- The median veterinarian earned $130,100 a year. (BLS OEWS, May 2025)
- New Hampshire has the most veterinarians per person, 45.9 per 100,000 residents, followed by Montana (44.6) and Vermont (43.4). (BLS OEWS, May 2025; Census Bureau)
- Mississippi has the fewest, 16.2 per 100,000 residents, followed by New York (16.9). (BLS OEWS, May 2025; Census Bureau)
- The best-served state has 2.8 times as many veterinarians per resident as the least-served. (BLS OEWS, May 2025; Census Bureau)
- 22 states, counting DC, fall below the national rate. (BLS OEWS, May 2025; Census Bureau)
- California employs the most veterinarians: 9,170. (BLS OEWS, May 2025)
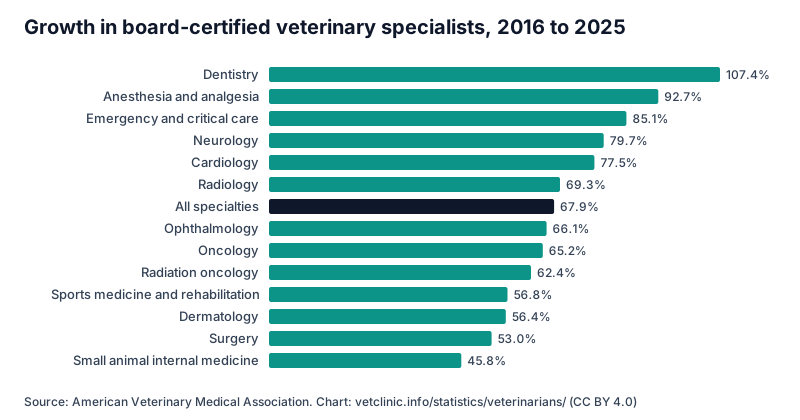
- AVMA counted 20,636 active board-certified veterinary specialists at the end of 2025, up 67.9% from 12,293 at the end of 2016. (AVMA, end of 2025; AVMA, end of 2016)
- There are 656 board-certified veterinary oncologists: one for every 521,000 U.S. residents. (AVMA, end of 2025; Census Bureau)
- Board-certified veterinary cardiologists number 497 and neurologists 557. (AVMA, end of 2025)
- Emergency and critical care specialists grew 85.1% in nine years, to 1,092. (AVMA, end of 2016; AVMA, end of 2025)
Veterinarians per 100,000 residents, by state
New Hampshire, Montana and Vermont have the most veterinarians per resident; Mississippi and New York have the fewest. The national rate is 24.5 per 100,000 residents, and 22 states, counting DC, fall below it. (BLS OEWS, May 2025; Census Bureau)
A low rate does not by itself mean that pets go without care: veterinarians cross state lines, and the count leaves out self-employed practice owners. Its strength is that it is measured the same way in every state.
| Rank | State | Vets per 100,000 residents | Employed veterinarians | Resident population | Median annual wage |
|---|---|---|---|---|---|
| 1 | New Hampshire | 45.9 | 650 | 1,415,342 | $128,190 |
| 2 | Montana | 44.6 | 510 | 1,144,694 | $99,390 |
| 3 | Vermont | 43.4 | 280 | 644,663 | $131,820 |
| 4 | Maine | 42.4 | 600 | 1,414,874 | $130,600 |
| 5 | Colorado | 38.9 | 2,340 | 6,012,561 | $130,840 |
| 6 | Oregon | 38.8 | 1,660 | 4,273,586 | $128,880 |
| 7 | Nebraska | 38.7 | 780 | 2,018,006 | $103,500 |
| 8 | Rhode Island | 38.6 | 430 | 1,114,521 | $126,570 |
| 9 | Minnesota | 36.7 | 2,140 | 5,830,405 | $133,110 |
| 10 | North Dakota | 33.8 | 270 | 799,358 | $102,180 |
| 11 | Kansas | 33.6 | 1,000 | 2,977,220 | $107,080 |
| 12 | Iowa | 30.9 | 1,000 | 3,238,387 | $124,610 |
| 13 | Missouri | 30.6 | 1,920 | 6,270,541 | $114,660 |
| 13 | Wisconsin | 30.6 | 1,830 | 5,972,787 | $108,780 |
| 15 | Virginia | 30.4 | 2,700 | 8,880,107 | $126,730 |
| 16 | South Dakota | 29.9 | 280 | 935,094 | $88,650 |
| 16 | Washington | 29.9 | 2,390 | 8,001,020 | $160,510 |
| 18 | Ohio | 28.8 | 3,430 | 11,900,510 | $125,060 |
| 19 | Oklahoma | 27.9 | 1,150 | 4,123,288 | $98,090 |
| 20 | District of Columbia | 27.4 | 190 | 693,645 | $134,530 |
| 21 | Arizona | 27.3 | 2,080 | 7,623,818 | $152,020 |
| 22 | Massachusetts | 26.8 | 1,920 | 7,154,084 | $140,260 |
| 23 | Pennsylvania | 26.7 | 3,490 | 13,059,432 | $133,520 |
| 24 | Idaho | 26.6 | 540 | 2,029,733 | $116,170 |
| 25 | North Carolina | 26.3 | 2,940 | 11,197,968 | $129,240 |
| 26 | Connecticut | 25.8 | 950 | 3,688,496 | $126,190 |
| 26 | Hawaii | 25.8 | 370 | 1,432,820 | $130,120 |
| 26 | Kentucky | 25.8 | 1,190 | 4,606,864 | $104,100 |
| 29 | South Carolina | 24.8 | 1,380 | 5,570,274 | $122,130 |
| 30 | Wyoming | 23.8 | 140 | 588,753 | $97,240 |
| 31 | Georgia | 23.6 | 2,670 | 11,302,748 | $126,590 |
| 31 | Tennessee | 23.6 | 1,730 | 7,315,076 | $124,350 |
| 33 | California | 23.3 | 9,170 | 39,355,309 | $163,920 |
| 34 | Florida | 22.8 | 5,360 | 23,462,518 | $131,660 |
| 34 | Maryland | 22.8 | 1,430 | 6,265,347 | $163,170 |
| 36 | West Virginia | 22.1 | 390 | 1,766,147 | $128,990 |
| 37 | Alaska | 21.7 | 160 | 737,270 | n/a |
| 37 | Delaware | 21.7 | 230 | 1,059,952 | n/a |
| 39 | New Mexico | 21.6 | 460 | 2,125,498 | $129,390 |
| 40 | Indiana | 21.5 | 1,500 | 6,973,333 | $124,530 |
| 41 | Nevada | 20.7 | 680 | 3,282,188 | $125,550 |
| 42 | Louisiana | 20.6 | 950 | 4,618,189 | $124,370 |
| 43 | Michigan | 20.0 | 2,030 | 10,127,884 | $125,390 |
| 43 | New Jersey | 20.0 | 1,910 | 9,548,215 | $160,140 |
| 45 | Texas | 19.8 | 6,270 | 31,709,821 | $131,330 |
| 46 | Alabama | 19.6 | 1,020 | 5,193,088 | $105,630 |
| 47 | Illinois | 18.3 | 2,330 | 12,719,141 | $133,580 |
| 48 | Utah | 18.1 | 640 | 3,538,904 | $123,990 |
| 49 | Arkansas | 17.3 | 540 | 3,114,791 | $107,710 |
| 50 | New York | 16.9 | 3,390 | 20,002,427 | $131,830 |
| 51 | Mississippi | 16.2 | 480 | 2,954,160 | $105,370 |
Board-certified veterinary specialists
A board-certified veterinary specialist has completed a residency and passed the examination of a specialty college recognised by the AVMA, such as the American College of Veterinary Internal Medicine (which certifies oncologists, cardiologists and neurologists) or the American College of Veterinary Surgeons.
AVMA counted 20,636 active diplomates at the end of 2025, 67.9% more than at the end of 2016. Emergency and critical care grew 85.1% and dentistry 107.4%. (AVMA, end of 2016; AVMA, end of 2025)
For pet owners the numbers stay small. There are 656 board-certified veterinary oncologists, one for every 521,000 U.S. residents, and 497 cardiologists, one for every 688,000. (AVMA, end of 2025; Census Bureau)
| Specialty | College | End of 2016 | End of 2025 | Change | U.S. residents per specialist |
|---|---|---|---|---|---|
| All specialties | All AVMA-recognised colleges | 12,293 | 20,636 | 67.9% | 17,000 |
| Oncology | ACVIM | 397 | 656 | 65.2% | 521,000 |
| Cardiology | ACVIM | 280 | 497 | 77.5% | 688,000 |
| Neurology | ACVIM | 310 | 557 | 79.7% | 614,000 |
| Small animal internal medicine | ACVIM | 1,342 | 1,957 | 45.8% | 175,000 |
| Emergency and critical care | ACVECC | 590 | 1,092 | 85.1% | 313,000 |
| Surgery | ACVS | 1,692 | 2,588 | 53.0% | 132,000 |
| Ophthalmology | ACVO | 419 | 696 | 66.1% | 491,000 |
| Dermatology | ACVD | 266 | 416 | 56.4% | 822,000 |
| Dentistry | AVDC | 149 | 309 | 107.4% | 1,106,000 |
| Radiology | ACVR | 502 | 850 | 69.3% | 402,000 |
| Radiation oncology | ACVR | 101 | 164 | 62.4% | 2,084,000 |
| Anesthesia and analgesia | ACVAA | 247 | 476 | 92.7% | 718,000 |
| Sports medicine and rehabilitation | ACVSMR | 192 | 301 | 56.8% | 1,135,000 |
Download the data (CSV) (AVMA, end of 2016; AVMA, end of 2025; Census Bureau)
Methodology
Employment and wage figures are Bureau of Labor Statistics Occupational Employment and Wage Statistics estimates for May 2025, for veterinarians (occupation code 29-1131). They count wage-and-salary jobs and exclude the self-employed, so practice owners who are not on a payroll are not counted and the total understates the number of practising veterinarians. The estimates come from a survey and carry sampling error, so small differences between states are not meaningful.
Rates per 100,000 residents divide each state's estimate by the Census Bureau's mid-year resident population estimate for 2025. The national rate uses the national estimate over the combined population of the states and DC.
Specialist counts are the American Veterinary Medical Association's published counts of active board-certified diplomates, at the end of 2016 and the end of 2025. Some veterinarians hold more than one specialty, so the rows do not add up to the total. We compare specialties listed in both years and not college totals, because the colleges changed in between (veterinary nutrition became part of ACVIM).
Residents per specialist divide the U.S. resident population by the specialist count. Some diplomates work abroad or in research, teaching or industry, so fewer are available to pet owners than this figure suggests.
Nothing on this page comes from the vetclinic.info directory of practices, which does not cover every state evenly.
Frequently asked questions
How many veterinarians are there in the United States?
BLS estimates 83,900 veterinarians in wage-and-salary jobs in May 2025. Self-employed practice owners are not included, so the full number of practising veterinarians is higher. (BLS OEWS, May 2025)
Which state has the most veterinarians per person?
New Hampshire, with 45.9 veterinarians per 100,000 residents. Mississippi has the fewest, with 16.2. (BLS OEWS, May 2025; Census Bureau)
How many board-certified veterinary oncologists are there?
AVMA counted 656 at the end of 2025, up from 397 at the end of 2016: one for every 521,000 U.S. residents. (AVMA, end of 2016; AVMA, end of 2025; Census Bureau)
How much do veterinarians earn?
The median annual wage for veterinarians was $130,100 in May 2025, according to BLS. (BLS OEWS, May 2025)
Can I reuse these statistics?
Yes. Our tables and charts are licensed CC BY 4.0, so you can quote, chart and republish them with a link to this page.
How to cite or reuse these statistics
You are free to quote, chart and republish the figures on this page, including commercially, as long as you credit vetclinic.info with a link to this page. Suggested citation:
vetclinic.info Data. "Veterinarian Statistics 2026: Vets per Person by State, and Specialist Counts." vetclinic.info, updated November 1, 2026. https://vetclinic.info/statistics/veterinarians/Or as a link:
<a href="https://vetclinic.info/statistics/veterinarians/">Veterinarian Statistics 2026: Vets per Person by State, and Specialist Counts</a> (vetclinic.info)Licence: our compiled tables and charts are published under CC BY 4.0. Figures from the U.S. Bureau of Labor Statistics and the Census Bureau are public domain; figures from other publishers remain theirs, so cite them as listed under Sources.
Sources
- Occupational Employment and Wage Statistics, May 2025: Veterinarians, U.S. Bureau of Labor Statistics (2026). Retrieved November 1, 2026.
- State Population Totals: 2020–2025 (NST-EST2025), U.S. Census Bureau. Retrieved November 1, 2026.
- Veterinary specialists in the U.S. (as of December 31, 2025), American Veterinary Medical Association. Retrieved November 1, 2026.
- Veterinary specialists 2016 (as of December 31, 2016), American Veterinary Medical Association (2017-01). Retrieved November 1, 2026.
How we compile these pages: editorial policy. Found an error? Write to [email protected] and we will correct it and note the change here.