Veterinarian shortage statistics: how many vets the U.S. trains, needs and forecasts
U.S. veterinary colleges enrolled a first-year class of 4,278 in 2025, while the Bureau of Labor Statistics projects about 3,100 openings for veterinarians a year from 2025 to 2035: about 1.4 new students for every projected opening. Source: AAVMC 2025 annual report; BLS Occupational Outlook Handbook, data as of 2025.
Key statistics
- BLS counted 91,100 veterinarian jobs in 2025 and projects 9% growth by 2035, against 3% for all occupations. (BLS Occupational Outlook Handbook)
- About 3,100 openings for veterinarians are projected each year, many of them to replace veterinarians who retire or change occupation. (BLS Occupational Outlook Handbook)
- U.S. veterinary colleges seat about 1.4 first-year students for every veterinarian opening BLS projects a year (4,278 students in 2025; our calculation). (AAVMC 2025 annual report; BLS Occupational Outlook Handbook)
- Applicants per first-year seat at U.S. veterinary colleges rose from 1.6 in 2015 to 2.4 in 2025. (AAVMC 2025 annual report)
- A record 16,143 students were enrolled in U.S. veterinary degree programs in 2025. (AAVMC 2025 annual report)
- The veterinary school application service drew 13,174 applicants in its 2026 cycle, up 7% on the year before. (AAVMC 2025 annual report)
- There are 1.5 veterinary technologists and technicians per veterinarian in the United States, from 2.7 in Texas to 0.6 in Arkansas (our calculation, May 2025). (BLS OEWS, vet techs; BLS OEWS, veterinarians)
- BLS projects about 13,400 vet tech openings a year, about 4.3 for every veterinarian opening (our calculation). (BLS Occupational Outlook Handbook, vet techs; BLS Occupational Outlook Handbook)
- USDA lists 255 designated veterinary shortage areas for fiscal year 2026, in 47 states; 149 of them (58%) show no loan-repayment award. (USDA NIFA shortage map)
- Mars Veterinary Health projected a shortfall of up to 24,000 companion-animal veterinarians by 2030, even after new graduates. (Mars Veterinary Health, 2023)
- An AVMA-commissioned forecast found graduates of existing U.S. colleges likely enough to meet demand through 2035; its peer-reviewed version found the data do not support an expected continued shortage. (AVMA News, October 2024; JAVMA, 2025)
- The class of 2026 graduated owing $227,588 on average among those with veterinary school debt, 1.5 times their expected starting income. (AVMA News, October 2026)
Vet school seats and applicants
U.S. colleges of veterinary medicine enrolled 4,278 first-year students in 2025, against 4,214 in 2015. Demand for those seats grew faster: there were 2.4 applicants per seat in 2025, against 1.6 in 2015. (AAVMC 2025 annual report)
Total enrollment reached a record 16,143 veterinary students in 2025, and the application service received 13,174 applicants for its 2026 cycle, up 7% on the year before. (AAVMC 2025 annual report)
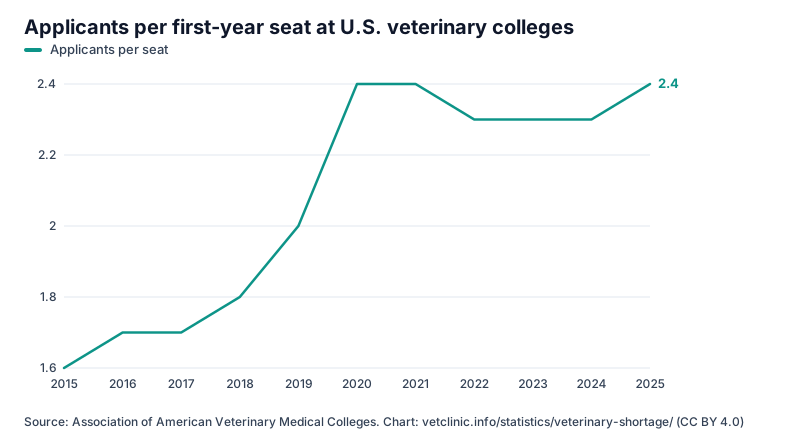
| Year | First-year DVM students | Applicants per seat |
|---|---|---|
| 2015 | 4,214 | 1.6 |
| 2016 | 4,039 | 1.7 |
| 2017 | 4,126 | 1.7 |
| 2018 | 4,200 | 1.8 |
| 2019 | 4,131 | 2.0 |
| 2020 | 4,298 | 2.4 |
| 2021 | 4,571 | 2.4 |
| 2022 | 4,755 | 2.3 |
| 2023 | 4,707 | 2.3 |
| 2024 | 4,113 | 2.3 |
| 2025 | 4,278 | 2.4 |
How many veterinarians the U.S. is projected to need
BLS projects employment of veterinarians to grow 9% from 2025 to 2035, from 91,100 jobs, and expects about 3,100 openings a year. Many of those openings replace veterinarians who retire or move to other occupations; they are not all new jobs. (BLS Occupational Outlook Handbook)
Set side by side, U.S. colleges seat about 1.4 first-year students for every projected opening. This is our comparison of two published figures, not a forecast: not every student graduates, the class that started in 2025 graduates about four years later, and graduates of accredited schools abroad, including in the Caribbean, also fill U.S. openings. (AAVMC 2025 annual report; BLS Occupational Outlook Handbook)
For veterinary technologists and technicians, BLS projects 9% growth and about 13,400 openings a year, about 4.3 for every veterinarian opening. (BLS Occupational Outlook Handbook, vet techs; BLS Occupational Outlook Handbook)
| Occupation | Jobs, 2025 | Projected growth, 2025–35 | Projected new jobs | Openings a year | Median pay, May 2025 | Source |
|---|---|---|---|---|---|---|
| Veterinarians | 91,100 | 9% | 8,600 | 3,100 | $130,100 | BLS Occupational Outlook Handbook |
| Veterinary technologists and technicians | 131,400 | 9% | 12,300 | 13,400 | $47,380 | BLS Occupational Outlook Handbook, vet techs |
Download the data (CSV) (BLS Occupational Outlook Handbook; BLS Occupational Outlook Handbook, vet techs)
Two forecasts, two answers
Mars Veterinary Health, which runs a network of veterinary hospitals, published a workforce study in August 2023 that said as many as 55,000 more companion-animal veterinarians would be needed by 2030, and that a shortfall of up to 24,000 would remain even after new graduates. (Mars Veterinary Health, 2023)
An analysis by Brakke Consulting, commissioned by the AVMA and presented in October 2024, reached the opposite conclusion: graduates of existing U.S. colleges are likely enough to meet demand through 2035, and the projections support neither an overall shortage nor excess capacity. Its peer-reviewed version, published in JAVMA in February 2025, found that the data do not support an expectation of a continued shortage. (AVMA News, October 2024; JAVMA, 2025)
The two use different methods, and each side has questioned the other: the Mars study's author argues that labor shortages are almost never calculated with supply-and-demand curves because the data are not sufficient, while the AVMA analysis's lead author argues that supply and demand cannot be set aside. We publish both and do not choose between them. (AVMA News, October 2024)
| Forecast and sponsor | Published | Looks to | More companion-animal vets needed | Shortfall after new graduates | Conclusion, in its own terms | Source |
|---|---|---|---|---|---|---|
| Mars Veterinary Health: "Pet Healthcare in the U.S.: Another Look at the Veterinarian Workforce" | Aug 2023 | 2030 | 55,000 | 24,000 | A shortage of companion-animal veterinarians will likely persist even with the new graduates expected over the decade. | Mars Veterinary Health, 2023 |
| Brakke Consulting for the AVMA, peer-reviewed in JAVMA | Feb 2025 | 2035 | Not estimated | None projected | Supply and demand both keep growing; the data do not support an expectation of a continued shortage. | JAVMA, 2025 |
Download the data (CSV) (Mars Veterinary Health, 2023; JAVMA, 2025)
Vet techs per veterinarian, by state
Nationally there are 1.5 veterinary technologists and technicians for every veterinarian: 129,140 and 83,900 in wage-and-salary jobs in May 2025. The most per veterinarian are in Texas, Utah and Alaska; the fewest are in Arkansas and the District of Columbia. (BLS OEWS, vet techs; BLS OEWS, veterinarians)
In 10 states, employed veterinarians outnumber employed vet techs. (BLS OEWS, vet techs; BLS OEWS, veterinarians)
This ratio is our calculation; BLS publishes the two counts separately. Veterinarians per resident, state by state, are on our veterinarian statistics page, linked below.
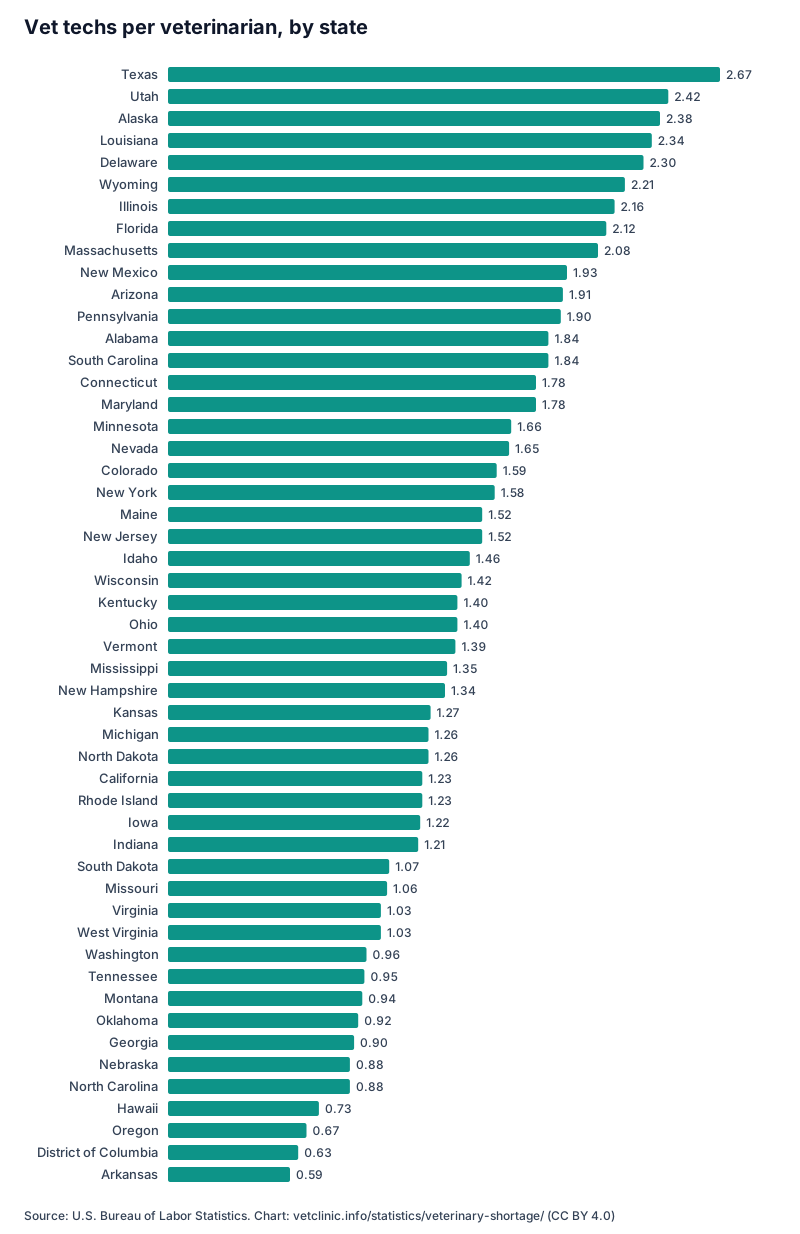
| Rank | State | Vet techs per veterinarian | Employed vet techs | Employed veterinarians |
|---|---|---|---|---|
| 1 | Texas | 2.67 | 16,730 | 6,270 |
| 2 | Utah | 2.42 | 1,550 | 640 |
| 3 | Alaska | 2.38 | 380 | 160 |
| 4 | Louisiana | 2.34 | 2,220 | 950 |
| 5 | Delaware | 2.30 | 530 | 230 |
| 6 | Wyoming | 2.21 | 310 | 140 |
| 7 | Illinois | 2.16 | 5,040 | 2,330 |
| 8 | Florida | 2.12 | 11,380 | 5,360 |
| 9 | Massachusetts | 2.08 | 3,990 | 1,920 |
| 10 | New Mexico | 1.93 | 890 | 460 |
| 11 | Arizona | 1.91 | 3,970 | 2,080 |
| 12 | Pennsylvania | 1.90 | 6,620 | 3,490 |
| 13 | Alabama | 1.84 | 1,880 | 1,020 |
| 13 | South Carolina | 1.84 | 2,540 | 1,380 |
| 15 | Connecticut | 1.78 | 1,690 | 950 |
| 15 | Maryland | 1.78 | 2,540 | 1,430 |
| 17 | Minnesota | 1.66 | 3,560 | 2,140 |
| 18 | Nevada | 1.65 | 1,120 | 680 |
| 19 | Colorado | 1.59 | 3,720 | 2,340 |
| 20 | New York | 1.58 | 5,350 | 3,390 |
| 21 | Maine | 1.52 | 910 | 600 |
| 21 | New Jersey | 1.52 | 2,910 | 1,910 |
| 23 | Idaho | 1.46 | 790 | 540 |
| 24 | Wisconsin | 1.42 | 2,590 | 1,830 |
| 25 | Kentucky | 1.40 | 1,670 | 1,190 |
| 25 | Ohio | 1.40 | 4,790 | 3,430 |
| 27 | Vermont | 1.39 | 390 | 280 |
| 28 | Mississippi | 1.35 | 650 | 480 |
| 29 | New Hampshire | 1.34 | 870 | 650 |
| 30 | Kansas | 1.27 | 1,270 | 1,000 |
| 31 | Michigan | 1.26 | 2,550 | 2,030 |
| 31 | North Dakota | 1.26 | 340 | 270 |
| 33 | California | 1.23 | 11,310 | 9,170 |
| 33 | Rhode Island | 1.23 | 530 | 430 |
| 35 | Iowa | 1.22 | 1,220 | 1,000 |
| 36 | Indiana | 1.21 | 1,820 | 1,500 |
| 37 | South Dakota | 1.07 | 300 | 280 |
| 38 | Missouri | 1.06 | 2,040 | 1,920 |
| 39 | Virginia | 1.03 | 2,790 | 2,700 |
| 39 | West Virginia | 1.03 | 400 | 390 |
| 41 | Washington | 0.96 | 2,290 | 2,390 |
| 42 | Tennessee | 0.95 | 1,640 | 1,730 |
| 43 | Montana | 0.94 | 480 | 510 |
| 44 | Oklahoma | 0.92 | 1,060 | 1,150 |
| 45 | Georgia | 0.90 | 2,410 | 2,670 |
| 46 | Nebraska | 0.88 | 690 | 780 |
| 46 | North Carolina | 0.88 | 2,580 | 2,940 |
| 48 | Hawaii | 0.73 | 270 | 370 |
| 49 | Oregon | 0.67 | 1,120 | 1,660 |
| 50 | District of Columbia | 0.63 | 120 | 190 |
| 51 | Arkansas | 0.59 | 320 | 540 |
Download the data (CSV) (BLS OEWS, vet techs; BLS OEWS, veterinarians)
USDA veterinary shortage areas, by state
The U.S. Department of Agriculture's National Institute of Food and Agriculture lists 255 designated veterinary shortage situations for fiscal year 2026, in 47 states. State animal health officials and federal veterinary officers nominate them, and a veterinarian who commits to serve in one can apply to have part of their student loans repaid. (USDA NIFA shortage map; AVMA News, January 2026)
These are not shortages of care for pets: 227 are in private food-animal practice, mostly in rural areas, and 28 are in public practice. The most are in Colorado (9); Connecticut, the District of Columbia, Massachusetts and Rhode Island have none. (USDA NIFA shortage map)
NIFA's map shows 106 of the 255 with a loan-repayment award for the 2026 cycle and 149 (58%) without one. (USDA NIFA shortage map)
| State | Designated shortage areas | Private food-animal practice | Public practice | With a loan-repayment award |
|---|---|---|---|---|
| Colorado | 9 | 9 | 0 | 5 |
| California | 8 | 8 | 0 | 2 |
| Nebraska | 8 | 6 | 2 | 3 |
| Texas | 8 | 7 | 1 | 4 |
| Utah | 8 | 8 | 0 | 2 |
| Wisconsin | 8 | 7 | 1 | 2 |
| Georgia | 7 | 6 | 1 | 0 |
| Idaho | 7 | 7 | 0 | 6 |
| Iowa | 7 | 7 | 0 | 5 |
| Kansas | 7 | 7 | 0 | 6 |
| Minnesota | 7 | 5 | 2 | 0 |
| Missouri | 7 | 6 | 1 | 5 |
| New York | 7 | 7 | 0 | 2 |
| Oklahoma | 7 | 7 | 0 | 3 |
| Washington | 7 | 6 | 1 | 3 |
| Wyoming | 7 | 6 | 1 | 5 |
| Arizona | 6 | 6 | 0 | 1 |
| Arkansas | 6 | 5 | 1 | 2 |
| Illinois | 6 | 6 | 0 | 2 |
| Michigan | 6 | 6 | 0 | 0 |
| Montana | 6 | 6 | 0 | 5 |
| New Mexico | 6 | 6 | 0 | 2 |
| North Carolina | 6 | 6 | 0 | 2 |
| North Dakota | 6 | 4 | 2 | 2 |
| Oregon | 6 | 6 | 0 | 1 |
| South Dakota | 6 | 6 | 0 | 4 |
| Alabama | 5 | 3 | 2 | 0 |
| Indiana | 5 | 4 | 1 | 2 |
| Kentucky | 5 | 4 | 1 | 0 |
| Mississippi | 5 | 5 | 0 | 2 |
| Ohio | 5 | 5 | 0 | 4 |
| Pennsylvania | 5 | 4 | 1 | 4 |
| Virginia | 5 | 5 | 0 | 2 |
| Alaska | 4 | 3 | 1 | 1 |
| Florida | 4 | 4 | 0 | 3 |
| Louisiana | 4 | 4 | 0 | 2 |
| Tennessee | 4 | 4 | 0 | 2 |
| Vermont | 4 | 4 | 0 | 2 |
| Delaware | 3 | 2 | 1 | 1 |
| Maryland | 3 | 0 | 3 | 0 |
| South Carolina | 3 | 2 | 1 | 2 |
| Hawaii | 2 | 0 | 2 | 1 |
| Maine | 2 | 2 | 0 | 1 |
| Nevada | 2 | 2 | 0 | 0 |
| New Hampshire | 2 | 2 | 0 | 2 |
| New Jersey | 2 | 1 | 1 | 0 |
| West Virginia | 2 | 1 | 1 | 1 |
| Connecticut | 0 | 0 | 0 | 0 |
| District of Columbia | 0 | 0 | 0 | 0 |
| Massachusetts | 0 | 0 | 0 | 0 |
| Rhode Island | 0 | 0 | 0 | 0 |
What new veterinarians owe
The class of 2026 graduated owing an average of $227,588 among those with veterinary school debt, or $185,424 across all graduates, including the 18.5% who owed nothing. For the class of 2025, the average among those with debt was $212,499. (AVMA News, October 2026; AVMA News, October 2025)
For graduates entering full-time work, average debt was 1.5 times expected starting income, and 43.3% of the class owed $200,000 or more. (AVMA News, October 2026)
Methodology
Job counts, projections, openings and median pay come from the Bureau of Labor Statistics Occupational Outlook Handbook, projections for 2025 to 2035. Its job counts include the self-employed, so they are higher than the wage-and-salary counts in BLS's Occupational Employment and Wage Statistics survey.
Vet techs per veterinarian divides each state's OEWS employment estimate for veterinary technologists and technicians (occupation code 29-2056) by its estimate for veterinarians (29-1131), for May 2025. Both are wage-and-salary counts from the same survey, so self-employed practice owners are left out of both. A state where BLS suppressed either estimate is shown as n/a and not ranked. The national ratio uses the national estimates. Veterinary assistants are a separate BLS occupation and are not counted, and the estimates come from a survey, so small differences between states are not meaningful.
Vet school figures are from the Association of American Veterinary Medical Colleges' annual report for 2025, read from the data labels of its chart of first-year enrollment and applicants per seat at U.S. colleges of veterinary medicine. AAVMC's application service also serves programs outside the United States.
Students per opening divides the latest first-year class by the BLS yearly average of projected openings. It compares two published figures at one moment. It does not account for students who do not graduate, the time to graduation, U.S. openings filled by graduates of schools abroad, or veterinarians who leave clinical work, and it is not a forecast.
USDA counts are our tally of NIFA's Veterinary Services Shortage Situations Map, read in November 2026 one state at a time. A shortage that covers counties in more than one state is counted once, under the state NIFA lists it in. Press reports from January, when the 2026 cycle opened, gave a lower total for the same cycle; NIFA's map is the primary list, and the list we counted is kept with this page's data.
The two forecasts are summarized in their publishers' own terms, with each study's date and sponsor. We do not rate them. Debt figures are from AVMA's survey of graduating seniors at U.S. colleges and two Caribbean colleges, as reported by AVMA News.
Nothing on this page comes from the vetclinic.info directory of practices, which does not cover every state evenly.
Frequently asked questions
Is there a shortage of veterinarians in the United States?
The forecasts disagree. Mars Veterinary Health projected a shortfall of up to 24,000 companion-animal veterinarians by 2030; an AVMA-commissioned analysis found graduates of existing colleges likely enough to meet demand through 2035. (Mars Veterinary Health, 2023; AVMA News, October 2024)
How many new veterinarians does the U.S. need each year?
BLS projects about 3,100 openings for veterinarians a year from 2025 to 2035. U.S. colleges enrolled 4,278 first-year students in 2025. (BLS Occupational Outlook Handbook; AAVMC 2025 annual report)
How hard is it to get into vet school?
There were 2.4 applicants per first-year seat at U.S. colleges in 2025, up from 1.6 in 2015, according to AAVMC. (AAVMC 2025 annual report)
How many vet techs are there per veterinarian?
1.5 nationally in May 2025, by our calculation from BLS employment estimates, from 2.7 in Texas to 0.6 in Arkansas. (BLS OEWS, vet techs; BLS OEWS, veterinarians)
How many veterinary shortage areas has USDA designated?
NIFA's map lists 255 for fiscal year 2026, in 47 states. All are food-animal or public-practice shortages, not shortages of care for pets. (USDA NIFA shortage map)
How much debt do new veterinarians have?
The class of 2026 owed $227,588 on average among those with veterinary school debt, according to AVMA. (AVMA News, October 2026)
Can I reuse these statistics?
Yes. Our tables and charts are licensed CC BY 4.0, so you can quote, chart and republish them with a link to this page.
How to cite or reuse these statistics
You are free to quote, chart and republish the figures on this page, including commercially, as long as you credit vetclinic.info with a link to this page. Suggested citation:
vetclinic.info Data. "Veterinarian Shortage Statistics 2026: Vet School Seats, Openings and Vet Techs per Vet." vetclinic.info, updated November 7, 2026. https://vetclinic.info/statistics/veterinary-shortage/Or as a link:
<a href="https://vetclinic.info/statistics/veterinary-shortage/">Veterinarian Shortage Statistics 2026: Vet School Seats, Openings and Vet Techs per Vet</a> (vetclinic.info)Licence: our compiled tables and charts are published under CC BY 4.0. Figures from the U.S. Bureau of Labor Statistics and the Census Bureau are public domain; figures from other publishers remain theirs, so cite them as listed under Sources.
Sources
- Occupational Outlook Handbook: Veterinarians, U.S. Bureau of Labor Statistics. Retrieved November 7, 2026.
- Occupational Outlook Handbook: Veterinary Technologists and Technicians, U.S. Bureau of Labor Statistics. Retrieved November 7, 2026.
- Occupational Employment and Wage Statistics, May 2025: Veterinarians, U.S. Bureau of Labor Statistics (2026). Retrieved November 7, 2026.
- Occupational Employment and Wage Statistics, May 2025: Veterinary Technologists and Technicians, U.S. Bureau of Labor Statistics (2026). Retrieved November 7, 2026.
- 2025 Annual Report: Year in Review, Association of American Veterinary Medical Colleges (2026-01). Retrieved November 7, 2026.
- Veterinary Services Shortage Situations Map, USDA National Institute of Food and Agriculture. Retrieved November 7, 2026.
- Applications open for federal Veterinary Medicine Loan Repayment Program, American Veterinary Medical Association (2026-01-22). Retrieved November 7, 2026.
- Tackling the Veterinary Professional Shortage, Mars Veterinary Health (2023-08). Retrieved November 7, 2026.
- No dire shortage of veterinarians anticipated in coming years, American Veterinary Medical Association (2024-10-04). Retrieved November 7, 2026.
- Incorporating model selection and uncertainty into forecasts of economic conditions in companion animal clinical veterinarian labor markets (MacLachlan, Volk and Doherty), Journal of the American Veterinary Medical Association (2025-02). Retrieved November 7, 2026.
- New veterinary graduates face rising debt, lower real income, American Veterinary Medical Association (2026-10-08). Retrieved November 7, 2026.
- Inflation continues to dampen gains in veterinarian salaries, fewer new grads entering full-time employment, American Veterinary Medical Association (2025-10-15). Retrieved November 7, 2026.
How we compile these pages: editorial policy. Found an error? Write to [email protected] and we will correct it and note the change here.