Pet insurance statistics: how many pets are insured, what it costs, and where
6.98 million dogs and cats were insured in the United States in December 2025, according to the North American Pet Health Insurance Association (NAPHIA): 4.27% of the country’s pets. By our calculation that is 20.4 insured pets per 1,000 residents. Source: NAPHIA State of the Industry 2026; Census Bureau, population, data as of December 2025.
Key statistics
- 6.98 million pets were insured in the United States in December 2025, up 9.0% in a year: 5.23 million dogs and 1.75 million cats. (NAPHIA State of the Industry 2026)
- That is 4.27% of the country’s dogs and cats: 5.99% of dogs and 2.29% of cats, by NAPHIA’s count of 87.3 million dogs and 76.3 million cats owned. (NAPHIA State of the Industry 2026)
- Pet insurers held $5.68 billion in annual premiums in force at the end of 2025, up 19.7% in a year and 2.2 times the $2.59 billion of 2021. (NAPHIA State of the Industry 2026)
- The average accident-and-illness policy cost $836 a year for a dog in 2025, about $70 a month, and $435 a year for a cat. (NAPHIA State of the Industry 2026)
- By our calculation, the average dog accident-and-illness premium rose 33.8% from 2021 to 2025, faster than prices for veterinarian services (26.8%) and consumer prices overall (16.2%). (NAPHIA State of the Industry 2026; BLS CPI: veterinarian services; BLS CPI: all items)
- The average cat premium rose 17.6% over the same years, less than vet prices. (NAPHIA State of the Industry 2026; BLS CPI: veterinarian services)
- By our calculation there are 20.4 insured pets per 1,000 U.S. residents. New Hampshire ranks first among the states, with 39.5 per 1,000 residents, ahead of Colorado (34.8) and New Jersey (34.4). (NAPHIA State of the Industry 2026; Census Bureau, population)
- California holds 18.1% of the country’s insured pets, more than any other state, but per resident it ranks seventh, at 32.1 per 1,000 residents. (NAPHIA State of the Industry 2026; Census Bureau, population)
- Louisiana has the fewest insured pets per resident of the states we can rank, 7.6 per 1,000 residents. Mississippi’s range, 3.5 to 6.0 per 1,000 residents, is the lowest of any state. (NAPHIA State of the Industry 2026; Census Bureau, population)
- The District of Columbia’s range, 35.2 to 45.3 insured pets per 1,000 residents, reaches higher than any state, but its share of insured pets is too small to rank. (NAPHIA State of the Industry 2026; Census Bureau, population)
- Cats were 25.1% of insured pets in 2025, up from 18.3% in 2021. Insured cats grew 16.3% in 2025 and insured dogs 6.8%. (NAPHIA State of the Industry 2026)
How many pets are insured in the U.S.
NAPHIA counted 6.98 million insured pets in the United States in December 2025, up 9.0% from a year earlier: 5.23 million dogs and 1.75 million cats. The count has risen every year since 2021, when it was 3.97 million; by our calculation that is a rise of 75.8% in four years. (NAPHIA State of the Industry 2026)
Cats are the faster-growing part. Insured cats rose 16.3% in 2025 and insured dogs 6.8%, and cats made up 25.1% of insured pets, up from 18.3% in 2021. (NAPHIA State of the Industry 2026)
NAPHIA puts the share of the country’s pets with insurance at 4.27%: 5.99% of dogs and 2.29% of cats. It divides insured pets by its count of pets owned, 87.3 million dogs and 76.3 million cats, which it attributes to an AVMA pet owner survey for 2025. (NAPHIA State of the Industry 2026)
Premiums have grown faster than the number of pets. Insurers held $5.68 billion in annual premiums in force at the end of 2025, up 19.7% in a year and 2.2 times the $2.59 billion of 2021. Policies for dogs brought in 84.5% of the premiums. (NAPHIA State of the Industry 2026)
| End of year | Premiums in force ($ billions) | Insured pets (millions) | Insured dogs (millions) | Insured cats (millions) | Cats’ share of insured pets |
|---|---|---|---|---|---|
| 2021 | 2.59 | 3.97 | 3.24 | 0.73 | 18.3% |
| 2022 | 3.22 | 4.85 | 3.88 | 0.96 | 19.9% |
| 2023 | 3.91 | 5.68 | 4.46 | 1.22 | 21.4% |
| 2024 | 4.74 | 6.41 | 4.90 | 1.51 | 23.5% |
| 2025 | 5.68 | 6.98 | 5.23 | 1.75 | 25.1% |
Premiums against vet prices
By our calculation, the average dog accident-and-illness premium rose 33.8% between 2021 and 2025, from $625 to $836. Over the same four years, from December 2021 to December 2025, the Consumer Price Index for veterinarian services rose 26.8% and the index for all items 16.2%. (NAPHIA State of the Industry 2026; BLS CPI: veterinarian services; BLS CPI: all items)
Cat premiums rose less: 17.6%, from $370 to $435, below the rise in vet prices. (NAPHIA State of the Industry 2026; BLS CPI: veterinarian services)
The comparison is a guide, not a measurement of the same thing. An average premium moves with the mix of plans and pets as well as with prices, while the price index follows a fixed basket of services. Our vet cost statistics page follows the price index month by month.
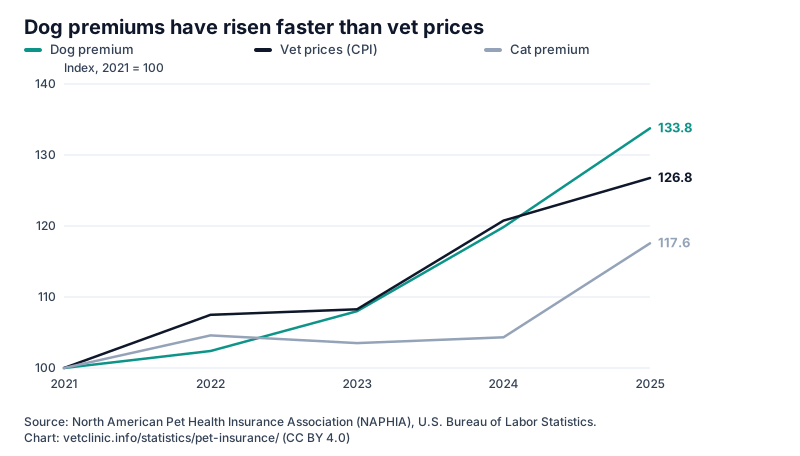
| Year | Dog accident-and-illness premium, a year | Cat accident-and-illness premium, a year | CPI: veterinarian services (December) | CPI: all items (December) |
|---|---|---|---|---|
| 2021 | $625 | $370 | 214.763 | 278.802 |
| 2022 | $640 | $387 | 230.847 | 296.797 |
| 2023 | $675 | $383 | 232.512 | 306.746 |
| 2024 | $749 | $386 | 259.354 | 315.605 |
| 2025 | $836 | $435 | 272.224 | 324.054 |
Download the data (CSV) (NAPHIA State of the Industry 2026; BLS CPI: veterinarian services; BLS CPI: all items)
Insured pets per resident, by state
NAPHIA publishes each state’s share of the country’s insured pets. We multiplied each share by NAPHIA’s national count and divided by the state’s residents, from the Census Bureau’s estimates for July 2025. Nationally there are 20.4 insured pets per 1,000 residents. (NAPHIA State of the Industry 2026; Census Bureau, population)
New Hampshire ranks first, with 39.5 insured pets per 1,000 residents, followed by Colorado (34.8) and New Jersey (34.4). Louisiana ranks last of the 37 states we can rank, at 7.6 per 1,000 residents, so the top state has about 5.2 times as many insured pets per resident. (NAPHIA State of the Industry 2026; Census Bureau, population)
Size and density are different things. California holds 18.1% of the country’s insured pets, more than any other state, but ranks seventh per resident, at 32.1 per 1,000 residents. Texas holds 6.1%, yet has 13.4 per 1,000 residents, below the national 20.4. (NAPHIA State of the Industry 2026; Census Bureau, population)
NAPHIA rounds each share to 0.1 percentage points, which matters most for small states. Where a share is under 0.5%, rounding alone could move the result by 12.5% to 50.0%, so for those 14 places the table gives a range and no rank. The District of Columbia’s range, 35.2 to 45.3 per 1,000 residents, reaches higher than any state; Mississippi’s, 3.5 to 6.0 per 1,000 residents, is the lowest. Even at 0.5%, rounding is worth up to 10.0% either way, so every row shows its range. (NAPHIA State of the Industry 2026; Census Bureau, population)
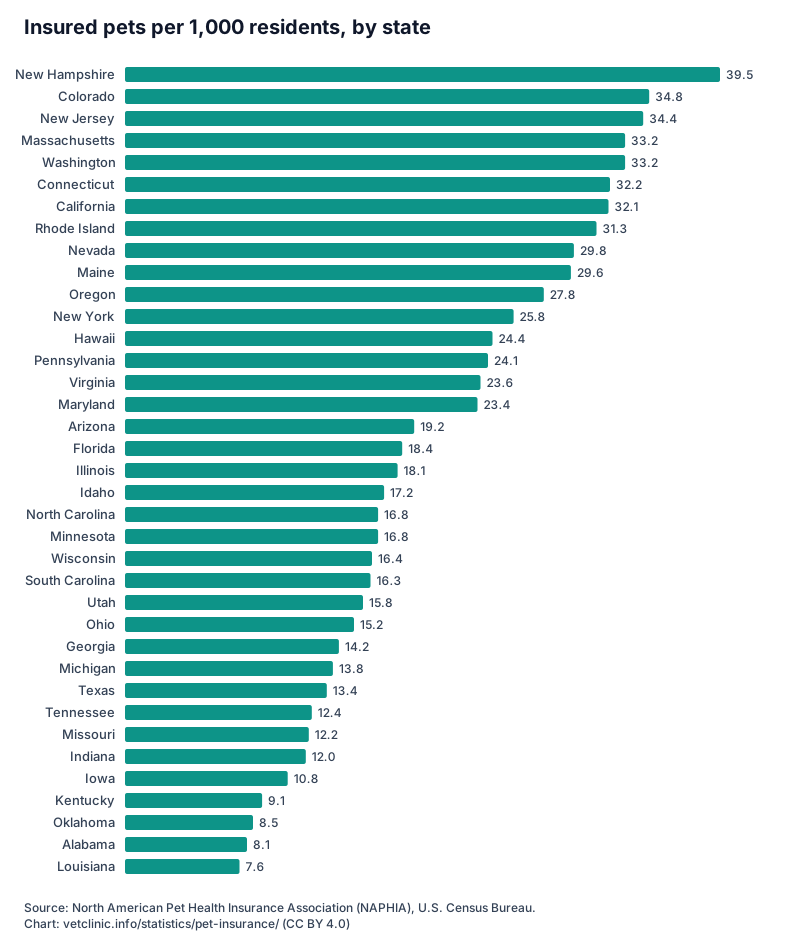
| Rank | State | Insured pets per 1,000 residents | Range: low | Range: high | Share of U.S. insured pets (NAPHIA) | Residents, July 2025 (Census) |
|---|---|---|---|---|---|---|
| — | District of Columbia | Range only | 35.2 | 45.3 | 0.4% | 693,645 |
| 1 | New Hampshire | 39.5 | 36.9 | 42.0 | 0.8% | 1,415,342 |
| 2 | Colorado | 34.8 | 34.2 | 35.5 | 3.0% | 6,012,561 |
| 3 | New Jersey | 34.4 | 33.9 | 34.8 | 4.7% | 9,548,215 |
| 4 | Massachusetts | 33.2 | 32.6 | 33.7 | 3.4% | 7,154,084 |
| 4 | Washington | 33.2 | 32.7 | 33.6 | 3.8% | 8,001,020 |
| — | Vermont | Range only | 27.0 | 37.9 | 0.3% | 644,663 |
| 6 | Connecticut | 32.2 | 31.2 | 33.2 | 1.7% | 3,688,496 |
| 7 | California | 32.1 | 32.0 | 32.2 | 18.1% | 39,355,309 |
| 8 | Rhode Island | 31.3 | 28.1 | 34.5 | 0.5% | 1,114,521 |
| 9 | Nevada | 29.8 | 28.7 | 30.9 | 1.4% | 3,282,188 |
| 10 | Maine | 29.6 | 27.1 | 32.1 | 0.6% | 1,414,874 |
| — | Alaska | Range only | 23.6 | 33.2 | 0.3% | 737,270 |
| 11 | Oregon | 27.8 | 26.9 | 28.6 | 1.7% | 4,273,586 |
| — | Delaware | Range only | 23.0 | 29.7 | 0.4% | 1,059,952 |
| 12 | New York | 25.8 | 25.6 | 26.0 | 7.4% | 20,002,427 |
| 13 | Hawaii | 24.4 | 21.9 | 26.8 | 0.5% | 1,432,820 |
| 14 | Pennsylvania | 24.1 | 23.7 | 24.4 | 4.5% | 13,059,432 |
| 15 | Virginia | 23.6 | 23.1 | 24.0 | 3.0% | 8,880,107 |
| 16 | Maryland | 23.4 | 22.8 | 24.0 | 2.1% | 6,265,347 |
| 17 | Arizona | 19.2 | 18.7 | 19.7 | 2.1% | 7,623,818 |
| 18 | Florida | 18.4 | 18.2 | 18.6 | 6.2% | 23,462,518 |
| — | Montana | Range only | 15.2 | 21.4 | 0.3% | 1,144,694 |
| 19 | Illinois | 18.1 | 17.8 | 18.4 | 3.3% | 12,719,141 |
| 20 | Idaho | 17.2 | 15.4 | 19.0 | 0.5% | 2,029,733 |
| 21 | North Carolina | 16.8 | 16.5 | 17.2 | 2.7% | 11,197,968 |
| 21 | Minnesota | 16.8 | 16.1 | 17.4 | 1.4% | 5,830,405 |
| 23 | Wisconsin | 16.4 | 15.7 | 17.0 | 1.4% | 5,972,787 |
| 24 | South Carolina | 16.3 | 15.6 | 17.0 | 1.3% | 5,570,274 |
| 25 | Utah | 15.8 | 14.7 | 16.8 | 0.8% | 3,538,904 |
| 26 | Ohio | 15.2 | 14.9 | 15.6 | 2.6% | 11,900,510 |
| 27 | Georgia | 14.2 | 13.8 | 14.6 | 2.3% | 11,302,748 |
| 28 | Michigan | 13.8 | 13.4 | 14.2 | 2.0% | 10,127,884 |
| 29 | Texas | 13.4 | 13.3 | 13.6 | 6.1% | 31,709,821 |
| — | New Mexico | Range only | 11.4 | 14.8 | 0.4% | 2,125,498 |
| 30 | Tennessee | 12.4 | 11.9 | 12.9 | 1.3% | 7,315,076 |
| 31 | Missouri | 12.2 | 11.6 | 12.9 | 1.1% | 6,270,541 |
| 32 | Indiana | 12.0 | 11.5 | 12.6 | 1.2% | 6,973,333 |
| — | Wyoming | Range only | 5.9 | 17.8 | 0.1% | 588,753 |
| 33 | Iowa | 10.8 | 9.6 | 11.9 | 0.5% | 3,238,387 |
| — | Nebraska | Range only | 8.6 | 12.2 | 0.3% | 2,018,006 |
| — | Kansas | Range only | 8.2 | 10.6 | 0.4% | 2,977,220 |
| 34 | Kentucky | 9.1 | 8.3 | 9.9 | 0.6% | 4,606,864 |
| — | North Dakota | Range only | 4.3 | 13.1 | 0.1% | 799,358 |
| 35 | Oklahoma | 8.5 | 7.6 | 9.4 | 0.5% | 4,123,288 |
| 36 | Alabama | 8.1 | 7.3 | 8.8 | 0.6% | 5,193,088 |
| — | West Virginia | Range only | 5.9 | 9.9 | 0.2% | 1,766,147 |
| 37 | Louisiana | 7.6 | 6.8 | 8.4 | 0.5% | 4,618,189 |
| — | South Dakota | Range only | 3.7 | 11.2 | 0.1% | 935,094 |
| — | Arkansas | Range only | 5.6 | 7.9 | 0.3% | 3,114,791 |
| — | Mississippi | Range only | 3.5 | 6.0 | 0.2% | 2,954,160 |
Download the data (CSV) (NAPHIA State of the Industry 2026; Census Bureau, population)
Methodology
Insurance figures are NAPHIA’s, from its June 2026 State of the Industry report on calendar year 2025. Willis Towers Watson compiles them from a survey of NAPHIA members and from public sources, and NAPHIA estimates that the data covers about 99% of pet insurance premiums written in the United States and Canada. Counts and premiums are for policies in force at the end of each year. (NAPHIA State of the Industry 2026)
Insured pets per 1,000 residents is our own calculation, not NAPHIA’s: each state’s share of insured pets from NAPHIA, multiplied by NAPHIA’s national count of 6.98 million, divided by the Census Bureau’s Vintage 2025 estimate of the state’s residents in July 2025, and multiplied by one thousand. (NAPHIA State of the Industry 2026; Census Bureau, population)
NAPHIA’s state shares come from its members’ data only, while its national count adds public sources, so the calculation assumes that pets insured outside NAPHIA’s membership are spread across the states the same way. The count of pets is at the end of the year and the count of residents at mid-year. (NAPHIA State of the Industry 2026)
Each state’s range takes its share half a rounding step either way and rounds outward. A state whose share is under 0.5% is shown as a range only and is not ranked. Rows are ordered by the central estimate, so the position of a ranged state in the table is approximate.
The figure counts insured pets per resident. It does not say what proportion of a state’s pets have insurance: that would need each state’s pet count, which AVMA publishes only in paid data.
Premium growth compares NAPHIA’s average annual accident-and-illness premium in 2021 and 2025. Vet prices compare the Consumer Price Index for All Urban Consumers, not seasonally adjusted, for veterinarian services and for all items, in December 2021 and December 2025: the same values our vet cost statistics page uses. The monthly cost is the annual premium divided by twelve. (NAPHIA State of the Industry 2026; BLS CPI: veterinarian services; BLS CPI: all items)
NAPHIA’s report is copyrighted, all rights reserved. Every NAPHIA figure here is quoted with a link to the report, and the state table is our own calculation from it. If NAPHIA objects to the table, we will take it down: write to [email protected]. (NAPHIA State of the Industry 2026)
This page has no affiliate links and recommends no insurer. Nothing on it comes from the vetclinic.info directory of practices. Our calculations, tables and charts are licensed CC BY 4.0; NAPHIA’s figures remain NAPHIA’s, so cite them to NAPHIA.
Frequently asked questions
How many pets have insurance in the U.S.?
NAPHIA counted 6.98 million insured pets in December 2025, 4.27% of the country’s dogs and cats: 5.23 million dogs and 1.75 million cats. (NAPHIA State of the Industry 2026)
How much does pet insurance cost?
The average accident-and-illness policy cost $836 a year for a dog in 2025, about $70 a month, and $435 a year for a cat, according to NAPHIA. (NAPHIA State of the Industry 2026)
Which state has the most pet insurance?
California has the most insured pets, 18.1% of the national total. Per resident, New Hampshire ranks first, with 39.5 insured pets per 1,000 residents by our calculation. (NAPHIA State of the Industry 2026; Census Bureau, population)
Is pet insurance getting more expensive?
For dogs, yes. By our calculation the average dog accident-and-illness premium rose 33.8% from 2021 to 2025, more than prices for veterinarian services (26.8%) over the same years. The average cat premium rose 17.6%. (NAPHIA State of the Industry 2026; BLS CPI: veterinarian services)
How big is the pet insurance market?
U.S. pet insurers held $5.68 billion in annual premiums in force at the end of 2025, up 19.7% in a year, according to NAPHIA. (NAPHIA State of the Industry 2026)
How to cite or reuse these statistics
You are free to quote, chart and republish the figures on this page, including commercially, as long as you credit vetclinic.info with a link to this page. Suggested citation:
vetclinic.info Data. "Pet Insurance Statistics 2026: How Many Pets Are Insured, What It Costs, and Insured Pets by State." vetclinic.info, updated November 7, 2026. https://vetclinic.info/statistics/pet-insurance/Or as a link:
<a href="https://vetclinic.info/statistics/pet-insurance/">Pet Insurance Statistics 2026: How Many Pets Are Insured, What It Costs, and Insured Pets by State</a> (vetclinic.info)Licence: our compiled tables and charts are published under CC BY 4.0. Figures from the U.S. Bureau of Labor Statistics and the Census Bureau are public domain; figures from other publishers remain theirs, so cite them as listed under Sources.
Sources
- The 2026 NAPHIA State of the Industry Report Highlights, North American Pet Health Insurance Association (NAPHIA) (2026-06-21). Retrieved November 7, 2026.
- State Population Totals: 2020–2025 (NST-EST2025), U.S. Census Bureau. Retrieved November 1, 2026.
- CPI-U, U.S. city average: Veterinarian services (CUUR0000SS62053), U.S. Bureau of Labor Statistics. Retrieved November 7, 2026.
- CPI-U, U.S. city average: All items (CUUR0000SA0), U.S. Bureau of Labor Statistics. Retrieved November 7, 2026.
How we compile these pages: editorial policy. Found an error? Write to [email protected] and we will correct it and note the change here.